3.2 GEOGRAPHY (312)
The year 2017 KCSE Geography examination was presented in two papers paper 1 (312/1) covers the physical geography and Map Reading while paper 2 (312/2) examines "Human and Economic Geography, Photographic Interpretation skills and Statistics". Each of the two papers had ten (10) questions.
This report analyses the performance of candidates in the year 2017 Geography examination papers, paying special attention to the poorly performed items It looks at what the questions tested, the candidates weaknesses and possible reasons for their poor performance. It also gives advice to Geography teachers with the aim of improving future performance in the subject.

3.2.1 GENERAL CANDIDATES' PERFORMANCE
The table below shows the overall performance in Geography over the period 2013 to 2017
Table 9: candidates overall performance in Geography for the last five years
| Year | Paper | Candidature | Maximum Score | Mean Score | Standard Deviation |
| 2013 | 1 2 Overall |
110,307 |
100 100 200 |
39.41 45.43 84.82 |
18.13 16.56 33.01 |
| 2014 | 1 2 Overall |
121,854 |
100 100 200 |
34.25 53.81 88.03 |
17.05 19.16 34.17 |
| 2015 | 1 2 Overall |
132,881 |
100 100 200 |
35.70 52.50 87.83 |
16.95 18.16 32.64 |
| 2016 | 1 2 Overall |
146,504 |
100 100 200 |
37.93 46.79 84.67 |
19.41 20.99 38.72 |
| 2017 | 1 2 Overall |
156,057 |
100 100 200 |
42.21 47.33 89.36 |
17.09 18.03 33.69 |
The following observations can be made from the table above:
- The candidature increased from 146,504 in 2016 to 156,057 in 2017
- There was a remarkable improvement in the overall performance of the subject from an overall mean of 84.67 in 2016 to 89.36 in 2017. The overall performance of the subject was average.
- There was a good improvement in performance in Geography paper one (312/1) from a mean of 37.9 in 2016 to 42.21 in 2017.
- The performance of Geography paper two (312/2) registered a slight improvement in perfor mance from a mean of 46.79 in 2016 to 47.33 in 2017.
- The standard deviation in both papers .17.09 in 312/1 and 18.03 in 312/2, shows a reasonable spread of candidates' scores from the mean.
Despite the improved performance, some questions performed poorly and they will be discussed in the section below.
3.2.2 Geography Paper 1 (312/1)
The performance of candidates in this paper slightly improved from a mean of 37.9 in 2016 to 42.21 in 2017. The paper adequately tested the syllabus and the questions were well balanced. This report will look at questions that registered poor performance, identify areas of weakness, the expected responses and general advice to teachers to improve performance.
The questions that performed poorly are: Q7 a (ii), Q8 a(ii),c. 9 a (iii),
b(i)(ii) 10b
Requirement Q 7a (ii)
Describe the following processes of formation of metamorphic rocks.
- Dynamic metamorphism (4 marks)
- Thermal metamorphism (4 marks)
Weaknesses
Majority of the candidates were unable to describe processes of metamorphism under the given sub headings. Dynamic and thermal metamorphism occur simultaneously hence it challenged the candidates to give description of the processes separately.
Expected responses
Describe the following processes of formation of metamorphle rocks.
- Dynamic metamorphism
- Original rock is subjected to intense pressure.
- Pressure is caused by compressional force when the crustal plates collide.
- The great pressure alters the mineral line up in the rock/structure.
- The rock changes their physical appearance and characteristics forming a new rock. - Thermal metamorphism
- Rocks are subjected to intense heat.
- Heat may be due to rocks being buried at great depths due to contact with magma.
- The hot magma melts the minerals of the original rock, they cool and solidify to form a totally different rock/recrystallize the rock grains.
- New minerals may also be added into the rock by the intruding magma.
- The new rocks change their physical appearance/chemical composition.
Advice to teachers
Teachers should engage candidates in discussion on formation of rocks using charts that show different types of rocks and the processes that lead to their formation. Frequent exercises and quizzes will assis in the mastery of content.
Requirement Q 8a (ii) c,
With an aid of a well labelled diagram, describe the formation of antielinorium and synclonorium complex. (6 marks)
Explain four effects of folding on physical environment. (8 marks)
Weaknesses
Majority of the candidates could not describe the formation of anticlinorium and syclinorium complex type of fold hence they could not illustrate the formation using a diagram. They also found it difficult to explain the effects of folding on physical environment.
Expected responses
With an aid of a well labelled diagram, describe the formation of anticlinorium and
syclinorium complex.
- Land is subjected to minor compressional force resulting to formation of minor folds on the surface.
-Greater compressional forces causes the land with minor folds to form large anticlines and synclines.
- The upfolds/anticlines are called anticlinorium while the downfolds/synclines are called syclinorium.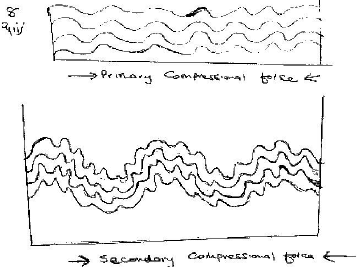
Explain four effects of folding on physical environment
-Fold Mountains receive heavy rainfall which give rise to rivers.
-Fold Mountains cause heavy rainfall in the windward slopes and little rainfall on the leeward slopes.
-The heavy rainfall on the windward side leads to growth of thick forests.
-The process of folding created crustal weakness which triggered off volcanic activities .
-In the mountainous regions, the cold wind descend to the lowland and valleys causing frost temperature inversion.
-In the Northern Hemisphere, the south facing slopes are warmer than the north facing slopes
-Folding leads to formation of different relief features/rugged landscape/ fold mountains.
Advice to teachers
Teachers should teach this topic more keenly using illustration as dictated by the syllabus. They should train learners to draw the relevant diagrams on folding and give frequent test on the complex parts of the topic. Teachers should be able to differentiate the physical from the human environment while teaching the effects of folding.
Requirement Q9 a (ii), b (i)(ii)
State the significance of the hydrological cycle.(4 marks)
Describe how the following lakes were formed.
morraine dammed lake (2 marks)
Oxbow lake (4 marks)
Weaknesses
Many candidates could not bring out the importance of the hydrological cycle; they instead brought out the importance of water. Candidates could not explain the formation of moraine dammed lakes and oxbow lakes
Expected responses
State the significance of the hydrological cycle
-Evapotranspiration increases water in the atmosphere
-It helps to regulate the surface water'underground water and water in the atmosphere
-It provides underground water through percolation
-Large rivers drain into oceans and lakes to form water bodies.
-Water evaporates from the ground causing drying up of water bodies/arid conditions . It controls the elements of weather such as temperatures/humidity and rainfall
-Water vapour maintains the heat energy in the atmosphere
-Moisture in the atmosphere influences both solar/ terrestrial radiation
Describe how the following lakes were formed.
Morraine dammed lake .
-It is formed when the valley glacier melts and moraine is deposited across the glacial troughs.
-The moraine forms a barrier and melt water collects behind it to form a moraine dammed lake.
-The water accumulates to form a moraine dammed lake.
Oxbow lake
-A meandering river erodes the outer bank of a meander and deposits material in the inner river bank.
-This deposition continues until a narrow picce of land is left separating the two bends.
-This is eventually eroded by floods forcing the river to flow on a straight channel.
-A loop of the meander is abandoned to form an oxbow lake.
Advice to teachers
Teachers should teach this topic more thoroughly; they can integrate class discussion with use of diagrams and field excursion to enhance comprehension of studied concepts. Simplified notes can be provided coupled with frequent assessment.
Requirement Q 10b
Describe the following properties of soil.
- Soil texture (2 marks)
- Soil porosity (2 marks)
- Soil colour (2 marks)
Weaknesses Candidates had difficulty describing properties of soils. They confused soil structure and soil profile, soil porosity and soil percolation. Many candidates mistook the outlined soil properties and gave wrong answers. Most answers showed limited knowledge on this topic.
Expected responses
Soil texture
-This is the degree of fineness or coarseness of the particles making up the soil.
-It is the size of the soil particles.
-The texture controls the size and spacing of the soil pores.
-This effects the soil water content/the drainage leaching soil aeration
Soil Porosity
-This is the amount of pore spaces in the soil.
-The size of the pore spaces determine the water flowing in the soil/sandy soils have high porosity hence allow water to pass through.
-Clay soils have few pores hence retain water.
Soil colour
-The soil have different colours influenced by parent rock/vegetation leaching processes.
-Black/dark brown soils denote a lot of humus.
-Grey soils are characteristics of poorly drained water logged soils.
-Whitish soils show high concentration of salts.
-Reddish soils have high concentration of iron.
Advice to teachers
Teachers should cover in details this topic and clarify concepts for easy interpretation and comprehension. They should practice concepts learnt by giving frequent tests and field study as indicated in the syllabus.
3.2.3 Geography Paper 2 (312/2)
The performance of candidates in this paper registered a slight improvement in performance from a mean of 46.79 in 2016 to 47.33 in 2017.
This report looks at question 1 a,b. 6b. 10b ii which presented some challenges in the way candidates attempted them.
Question Q1 a,b
Identify three counties in Kenya where wheat is grown on a large scale. (3 marks)
State three climatic conditions that affect wheat farming. (3 marks)
Weaknesses
Some candidates failed to know the counties where wheat is grown, while others were mixed up on the climatic conditions that affect wheat growing. Some gave the conditions for growing.
Expected responses
Identify three counties in Kenya where wheat is grown on a large scale.
- Narok
- Nakuru
- Uasin Gishu
- Nyandarua
- Meru
- Laikipia
- Transzoia
- Elgeyo Marakweti
State three climatic conditions that affect wheat farming.
- Frost
- Drought/Unreliable rainfall/very heavy rainfall
- Prolonged cold/hot seasons/high temperatures
- Strong winds which cause soil erosion
- Hailstones.
Advice to teachers
Teachers should practice teaching this area using atlases and give learners tasks to locate the counties, they should thoroughly teach the conditions for wheat growing under different categories. Teachers should caution learners to always read and understand the question requirement.
Question 6 b
Draw a compound bar graph to represent the number of visitors to selected national parks in Kenya Use the scale of 1 cm to represent 100,000 visitors. (10 marks)
State three advantages of using compound bar graphs to represent geographical data. (3 marks)
Weaknesses
Most candidates could not correctly draw the compound bar graph and the segments, candidates lacked the relevant skill or understanding to draw the graph.
Expected responses
A compound bar graph to represent the number of visitors to selected national parks in Kenya.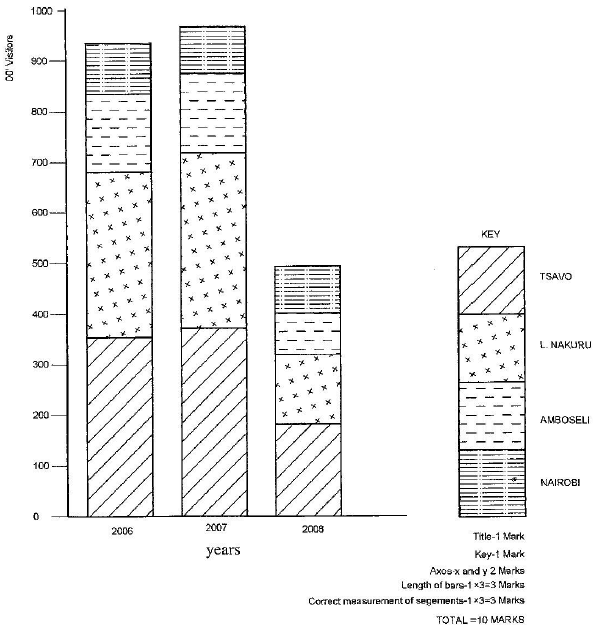
State three advantages of using compound bar graphs to represent geographical data.
- They give clear visual impression.
- They allow easy comparison
- They are easy to interpret/read.
- They can be used to represent a wide range of data/varibles,
Advice to teachers
Teachers should train and teach candidates to draw compound bar graphs as indicated in the syllabus. The compound bar graph seemed to have been ignored hence teachers should cover thoroughly the all statistical methods.
Question 9 a, c
Explain the following types of settlement patterns
- Dispersed settlement pattern (4 marks)
- Nucleated settlement pattem (2 marks)
State factors which led to the growth of Kisumu as a lake Port. (7 marks)
Weaknesses
Most candidates confused settlement patterns with population. They also confused functions of Kisumu as a port, city and urban centre.
Expected responses
Explain the following types of settlement pallets
Dispersed settlement pattern
- Dwellings/structures are scattered
- The dwelings may be separated from one another by physical features.
- The dwelings are found a distance apart.
Nucleated settlement patter
- The houses, shops and other buildings are close to cach other in one place.
State factors which led to the growth of Kisumu as a Lake port
- Early settlement by Asians led to commercial development of the town.
- It is strategically located on the shores of Lake Victoria.
- It is surrounded by areas with dense population which provide labour/market,
- It has ample water supply from Lake Victoria for industrial/domestic use.
- It has well developed transport systems/railwayfroads/air port.
- It is the headquarters of Kisumu County/Nyanza region.
- It has a rich agricultural hinterland which provides raw materials for industries.
- It has many industries.
- Fishing activities in lake Victoria.
- It is the terminus for the kenya/Uganda railway.
Advice to teachers
Teachers should emphasize the coverage of the topic more thoroughly and integrate the teaching with field study for more understanding and mastery of content.
3.2.4 GENERAL COMMENTS
- Teachers should comprehensively cover the syllabus within the time allocated, marked by indepth teaching of terms and concepts. The comparative studies outlined in the syllabus should be emphasized using approved revision books/Case Studies/Field work.
- Teachers should effectively test on the syllabus topics and desist from using unapproved revision examinations, they can use the KNEC past papers or teacher made tests. They should train candidates on approaches to answer questions to avoid using generalised approach.
- The teachers should train their students to use the rubrie (instructions to candidates) and follow it during examinations. They should learn to thoroughly read and understand the requirement of each question before making an attempt.
- The teachers should expose students to discussions and debates and use of teaching and learning aids like videos, maps, charts and atlases in geography lessons for the learners to understand the concepts better. The resources should be carefully chosen.
- Students should be exposed to varied topographical maps, photographs and statistical data for frequent practice on map reading, photo interpretations, statistical data calculation and interpretation to enhance acquiring of different skills.
- Field excursions/study should be encouraged for better understanding of taught concept.
- Candidates should be encouraged to do in depth revision and reading on the topics covered in the syllabus using the relevant diagrams. Rote learning should be discouraged.
- There is need for in-service training for geography teachers on how to handle the syllabus and detailed supervision by the quality and standards subject officers in the department of education at the county levels County levels.
- County subject specialists seminars /workshop should be held on annual basis to brainstorm on the best approach to improve subject performance and popularity.
Download GEOGRAPHY PAPER REPORT - KCSE 2017 REPORTS.
Tap Here to Download for 50/-
Get on WhatsApp for 50/-
Why download?
- ✔ To read offline at any time.
- ✔ To Print at your convenience
- ✔ Share Easily with Friends / Students