
-
- You are provided with
- 4M sodium hydroxide solution labeled solution x
- 2M Hydrochloric acid labeled as solution Z
- 0g of impure anhydrous sodium carbonate labeled solid P
You are required to determine the percentage purity of solid P.
Procedure - Using 100ml measuring cylinder, measure 80cm3 of solution Z and place it in a 250ml beaker.
- Add all the solid P to the acid in the beaker and stir with a glass rod until effervescence stops.
- Transfer the content of the beaker carefully into a 250ml volumetric flask and add distilled water upto the mark.
- Label this solution Y
- Fill a burrete with solution Y.
- Using a clean pipette and pipette filler, put 25cm 3 of solution X into a conical flask.
- Add three drops of phenolphthalein indicator and titrate using solution Y.
- Repeat the titration two more times and complete the table below
Table 1
I
II
III
Final burette reading (cm3)
Initial burette reading (cm3)
Volume of solution Y used (cm3)
- Calculate
- Average volume of solution Y used (1mk)
- Number of moles of solution X in 25cm3 (1mk)
- Concentration of solution Y in moles per litre. (2mks)
- Number of moles of HCl in 250cm3 of solution (1mk)
- Original number of moles in 80cm3 of solution Z (1mk)
- Number of moles of HCl that reached with the carbonates (1mk)
- Number of moles of sodium carbonate (1mk)
- Mass of sodium carbonate used (1mk)
- The percentage purity of solid P (1mk)
- Calculate
- You are provided with
- You are provided with 4.0g of oxalic acid labeled solid Q. You are required to determine the solubility of solid Q at different temperature.
Procedure- Transfer all solid Q into a clean dry boiling tube.
- Using a burette add 4cm3 of distilled water to solid Q in the boiling tube.
- Heat the mixture while stirring with the thermometer until all the solid dissolves.
- Allow the solution to cool while stirring with the thermometer and note the temperature at which crystals start to appear record the temperature in table 2.
- Add 2cm3 of water into the mixture in the boiling tube and repeat the procedure. Continue adding 2cm3 portions of water until total volume of water is 12cm3. Note the temperature at which crystallization occurs in each case and record the temperature in table 2.
Table 2
Volume of distilled water in the boiling tube (cm3)
Temperature on 0c at which crystals first appear
Solubility of solid Q in g/100g of water
4
6
8
10
12
- Complete the table 2 by calculating the solubility of solid Q in g/100g of water(5mks)
- On the grid provided plot a graph of solubility of solid Q against temperature(3mks)
- Determine the solubility of solid Q at 550 (1mk)
- You are provided with solid T. Carry out the tests below and record your observations and inferences in the spaces provided.
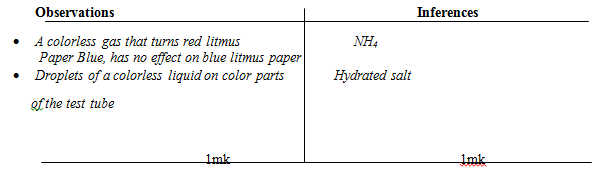
- Place about a third of solid T in a dry test tube and heat it strongly. Test any gas produced with most red and blue litmus paper
Observations
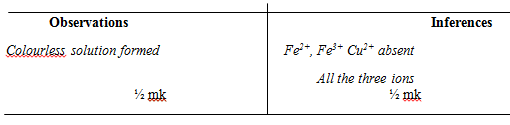
Inferences - Dissolve the remaining solid in distilled water and divide the solutions in to four portions
Observations
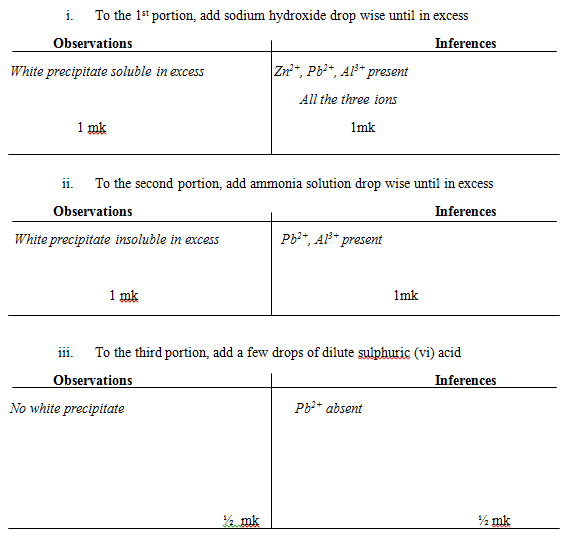
Inferences - To the 1st portion, add sodium hydroxide drop wise until in excess
Observations
Inferences - To the second portion, add ammonia solution drop wise until in excess
Observations
Inferences - To the third portion, add a few drops of dilute sulphuric (vi) acid
Observations
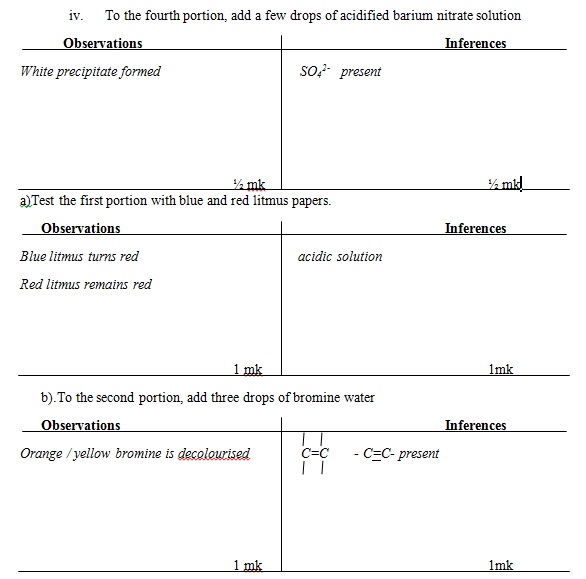
Inferences - To the fourth portion, add a few drops of acidified barium nitrate solution
Observations
Inferences
- Place about a third of solid T in a dry test tube and heat it strongly. Test any gas produced with most red and blue litmus paper
- You are provided with solid R. Carry out the tests below and record your observations and inferences in the spaces provided.
Place all solid R into a boiling tube. Add 10cm3 of distilled water and shake well. Use 2cm3 portions of the mixture for the following reactions.- Test the first portion with blue and red litmus papers.
Observations
Inferences - To the second portion, add three drops of bromine water
Observations
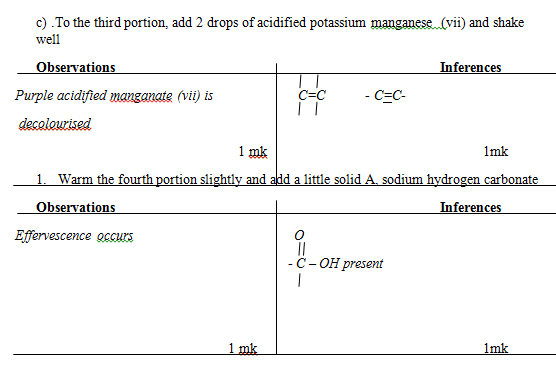
Inferences - To the third portion, add 2 drops of acidified potassium manganese (vii) and shake well
Observations
Inferences - Warm the fourth portion slightly and add a little solid A, sodium hydrogen carbonate
Observations
Inferences
- Test the first portion with blue and red litmus papers.

MARKING SCHEME
- Calculate
- Average volume of solution Y used (1mk)
24.0+24.0+24.0
3
= 24.0 cm3 - Number of moles of solution X in 25cm3 (1mk)
25x0.4
1000
= 0.01 moles - Concentration of solution Y in moles per litre. (2mks)
NaOH(aq) + HCl(aq) à NaCl(aq) + H2O(l)
0.01 moles à 24.0 cm3
1000x0.01
24.0
= 0.4167M - Number of moles of HCl in 250cm3 of solution (1mk)
0.01 moles= 24.0cm3
? = 250 cm3
250x 0.01
24.0
= 0.1042 moles - Original number of moles in 80cm3 of solution Z (1mk)
2x80
1000
= 0.16 moles - Number of moles of HCl that reached with the carbonates (1mk)
0.16- .1042
= 0.0558 moles - Number of moles of sodium carbonate (1mk)
Na2 CO3(s) +2HCl (aq) →2NaCl (aq) + CO2 (g) + H2O (l)
= ½ x 0.0558
= 0.00279 moles - Mass of sodium carbonate used (1mk)
0.0279 x 106
= 2.9574g - The percentage purity of solid P (1mk)
2.9574 x 100
5
= 59.148%
- Average volume of solution Y used (1mk)
-
Complete the table 2 by calculating the solubility of solid Q in g/100g of water (5mks)Volume of distilled water in the boiling tube (cm3)
Temperature on 0c at which crystals first appear
Solubility of solid Q in g/100g of water
4
69.0
112.50
6
59.0
75.0
8
54.0
56.25
10
48.0
45.00
12
44.0
37.50
C.T 3 mks. (correct arithmetic each mark ½ mk)
Trend (reducing temperature) 1mk
Decimal place (consistent) 1 mk- On the grid provided plot a graph of solubility of solid Q against temperature (3mks)
Provide graph paper. Labeling ½ mk
Scale ½ mk
Plotting 1mk
Curve 1mk - Determine the solubility of solid Q at 550 (1mk)
Showing on the graph ½ 66g/ 100 of water
- On the grid provided plot a graph of solubility of solid Q against temperature (3mks)
-
- Place about a third of solid T in a dry test tube and heat it strongly. Test any gas produced with most red and blue litmus paper
- Dissolve the remaining solid in distilled water and divide the solutions in to four portions
-
- Place about a third of solid T in a dry test tube and heat it strongly. Test any gas produced with most red and blue litmus paper
Join our whatsapp group for latest updates
Tap Here to Download for 50/-
Get on WhatsApp for 50/-
Download CHEMISTRY PAPER 3 - KCSE 2019 NYANDARUA PRE MOCK EXAMINATION.
Tap Here to Download for 50/-
Get on WhatsApp for 50/-
Why download?
- ✔ To read offline at any time.
- ✔ To Print at your convenience
- ✔ Share Easily with Friends / Students