0 votes
350 views
in Business Studies Form 3 by

The diagram below shows the equilibrium price and quantity of commodity A which is produced jointly with commodity B.
do do-demand curve
so so - supply curve
PE -Equilibrium point
QE -Equilibrium quantity
         diagram on equilibrium price and quantity of commodity

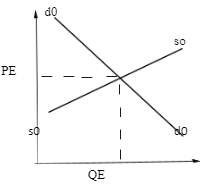
  1. On the diagram show the effect of a decrease of tax charged on commodity B on the equi8librium price and quantity of commodity A
  2. Explain the effect of a decrease of tax charged on commodity B on the equilibrium price and quantity of commodity A

1 Answer

0 votes
by

  1. diagram showing effect of decrese of tax on commodity
  2.  
    1. When tax charged on commodity B, decrease its supply and that of commodity A increases
    2. The supply curve of commodity A shifts outwards to the right to S1S1 
    3. The equilibrium price decreases from PE0 to PE1 
    4. The equilibrium quantity increases from QE0 to QE 1 
Welcome to EasyElimu Questions and Answers, where you can ask questions and receive answers from other members of the community.

6.4k questions

9.6k answers

6 comments

590 users

...