0 votes
365 views
in Business Studies Form 3 by

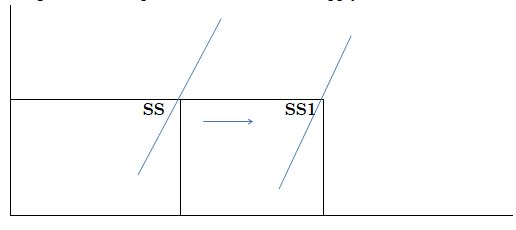
The diagram below represents a shift on the supply curve.
diagram reppresentiing shift on the supply curve
Give 4 reasons why SS has shifted to S1S1.

1 Answer

0 votes
by
  1. Improved technology on production
  2. Favourable weather conditions
  3. Favourable changes in government policy
  4. A decrease in cost of production
  5. Expected fall in price in the future
Welcome to EasyElimu Questions and Answers, where you can ask questions and receive answers from other members of the community.

6.4k questions

9.6k answers

6 comments

590 users

...