
INSTRUCTIONS TO CANDIDATES
- Answer all questions in the spaces provided.
- You are supposed to spend the first 15 minutes of the 2½ hours allowed for this paper reading the whole paper carefully before commencing your work.
- Marks are given for a clear record of observations actually made, their suitability, accuracy and the use made of them.
- Non-programmable silent electronic calculators and KNEC Mathematical tables may be used in calculations.
- PART A
You are provided with the following:-- A boiling tube.
- Some dry sand.
- A liquid in a measuring cylinder labelled L.
- Half metre rule.
- A vernier calipers (to be shared)
- A weighing machine (one per form)
- Tissue paper.
- A measuring cylinder.
Proceed as follows:- Measure the length of the boiling tube.h = ___cm (½mk)
- Put a little amount of sand in the boiling tube and place it in the measuring cylinder which is almost filled with liquid L. Add sand, little by little until the tube floats upright as shown in fig. 1
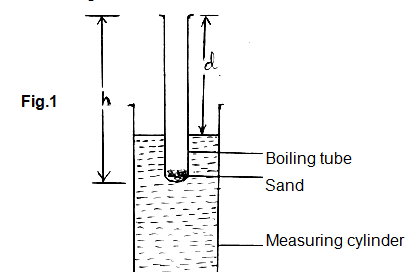
- Measure the length, d, of the boiling tube which is above the liquid. d= __ cm (½mk)
- Determine the length, t, of the boiling tube which is immersed in the liquid.t = ____cm (½mk)
- Remove the boiling tube from the measuring cylinder, wipe it dry (on the outside) and measure its mass, m, including the sand inside.m = ___g (½mk)
- Measure the external diameter, D, of the boiling tube.D = ____ cm (½mk)
- Determine the external radius, RR = ____ cm (½mk)
- Using the formula m = 12pπR2, determine p for the liquid.p____ cm (3mks)
PART B
You are provided with the following:-- A white screen with cross wires labelled O.
- A lens and a lens holder.
- A white screen labelled S.
- A metre rule.
- A candle.
- Set up the apparatus as shown in fig. 2.
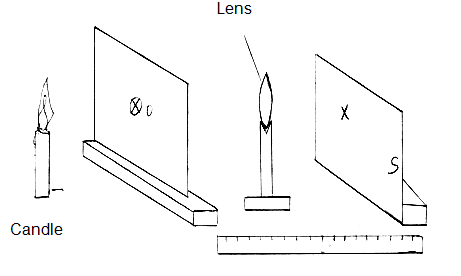
- Position the lens so that the object distance u = 20cm.
- Adjust the screen S so that a sharp image of the cross wire is formed on the screen S. Measure the image distance v. Record the value u and the corresponding value of v in table 1.
- Repeat (b) and (c) above for other values of u in table 1.
- Complete table 1.
u (cm)
20
25
30
35
40
45
v (cm)
u + v (cm)
uv (cm2)
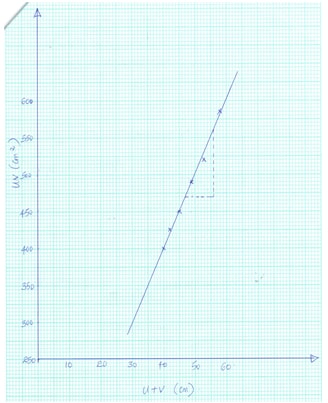
- On the grid provided, plot a graph of uv against (u+v) (5mks)
- Determine the slope of the graph and state its significance. (3mks)
- Set up the apparatus as shown in fig. 2.
- You are provided with the following apparatus:-
- A voltmeter
- An ammeter
- A switch
- 6 connecting wires (one with a crocodile clip)
- 2 new dry cells.
- A cell holder.
- A nichrome wire mounted on a millimetre scale.
Procedure- Connect the apparatus as shown in fig. 3
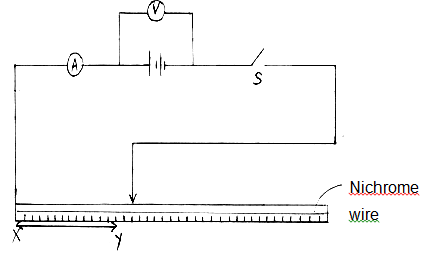
- With the crocodile clip at y, 80cm from x, close the switch and record the voltmeter reading and the corresponding ammeter reading in table 2.
- Repeat the procedure in part (b) for other lengths of xy as shown in table 2. complete the table.
Length (xy) cm
80
70
60
50
40
30
20
Voltmeter reading (V)
Ammeter reading (A)
-
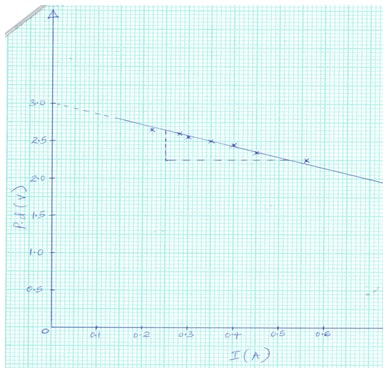
- On the grid provided, plot a graph of p.d(V) against current I (A). (5mks)
- Determine the slope of your graph. (3mks)
- Given that V = K1I + K2 where K1 and K2 are constants, determine:
- The value of K1. (1mk)
- The value of K2. (1mk)
- What quantity do constants K1 and K2 represent? (2mks)
- State the reason why the switch should be open when no readings are being taken. (1mk)
- Connect the apparatus as shown in fig. 3

MARKING SCHEME
- PART A
- h = 15cm + 1cm
- d = 2cm + 1cm
- t = h – d = (15.0 – 2.0)cm=13.0cm
- m = 61.2g + 10g
- D = 2.53cm +1cm
- R = D = 53 = 1.265cm
2 2 - m =12pπR2
=> p = m
13πR2
=61.2
12 x 3.142 x (1.265)2
=61.2
60.335
=1.014gcm-3
PART B -
u (cm)
20
25
30
35
40
45
v (cm)
20
17
15
14
13
13
3mks
u + v
40
42
45
49
53
58
1½ mks
uv (cm2)
400
425
450
490
520
585
1½ mks
Values of V within +4cm of the given value – ½mk each.
Values of u + v – Each ½ mk each to a max. of 3 values – use the candidate’s value correctly added.
Values of uv – ½ mk each to a max of 3 values – use the candidate’s value correctly worked. -
Axes correctly labelled with correct units – 1mk
Appropriate scale, simple, covering all values and at least half of the grid – 1mk
Each point correctly plotted to within one small square – ½ mk to a max of 4 points.
Line passing through at least 3 correctly plotted points – 1mk. - Slope = Δuv (Evidence on the graph)
Δu
= (560 – 470)cm2
(56 – 47)cm
= 90 = 10cm
9
Significance – Focal length of the lens.
-
-
Length (xy) cm
80
70
60
50
40
30
20
Voltmeter reading (V)
2.65
2.60
2.55
2.50
2.45
2.35
2.25
3½ mks
Ammeter reading (A)
0.22
0.28
0.30
0.35
0.40
0.45
0.56
3½ mks
- Award ½ mk for each correct value of V and I. -
Labelling – 1mk (Axes correctly labelled with correct units).
Scale – 1mk – Appropriate scale, simple, covering all values.
Plotting – 2mks – Each point correctly plotted to within one small square – ½ mk each to a max of 4 points.
Line – 1mk – should pass through atleast 3 correctly plotted points. - Slope = Δv (Evidence on the graph)
ΔI
= (2.25 – 2.65)v
(0.52 – 0.25)A
= -0.4
0.27
= -1.481Ω - V = K1I + K2
K1 = Gradient
= -1.481Ω - K2 = Y – intercept
= 3.0V - K1 – Internal resistance.
K2 – E.M.F. of the cells. - To minimize errors due to heating effect of electric current.
-
Join our whatsapp group for latest updates
Tap Here to Download for 50/-
Get on WhatsApp for 50/-
Download PHYSICS PAPER 3 - 2019 KCSE TAP TRIAL MOCK EXAMS (QUESTIONS AND ANSWERS).
Tap Here to Download for 50/-
Get on WhatsApp for 50/-
Why download?
- ✔ To read offline at any time.
- ✔ To Print at your convenience
- ✔ Share Easily with Friends / Students