
QUESTION 1
- You are provided with solution A and solution B
- Solution A is 1.25M hydrochloric acid
- Solution B is 0.16M hydroxide of metal M with formulae M(OH)x where x is a whole number
- You are required to carry out the experiment to determine the value of x
PROCEDURE
- Using a measuring cylinder, measure 50cm3 of solution A into a clean 250cm3 volumetric flask and make upto the mark with distilled water-label this solution W
- Fill a clean burette with solution W
- Pippette 25cm3 of solution B into a clean conical flask and add 2 drops of phenolphthalein indicator
- Titrate solution B in the conical flask against solution A from the burette and record the results in the table below
- Repeat [3] and [4] above as you record the results in the table below
I
II
III
FINAL BURETTE READING [cm3]
INITIAL BURETTE READING[cm3]
VOLUME OF SOLUTION W USED
- Calcualte the;
- Average volume of solution W [1mk]
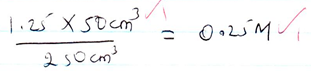
- Concentration of solution W [2mks]
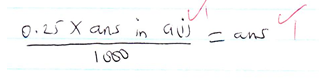
- Number of moles of hydrochloric acid [in solution W] that reacted with each 25cm3 portion of the solution of the metal hydroxide [solution B] [2mks]
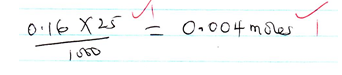
- Number of moles of the metal hydroxide [solution B] that reacted with each portion of hydrochloric acid [solution W] [2mks]
- Determine the stoichiometric equation of the reaction between the hydrochloric acid and the metal hydroxide solution [2mks]
- Hence State the value of X [2mks]
- Calcualte the;
QUESTION 2
- You are provided with 0.5g of oxalic acid as solid C
- You are required to carry out the experiment to determine the solubility of the solid at different temperature
PROCEDURE
- Fill a clean burette with distilled water
- Put all the solid C into a clean boiling tube and then add 4cm3 of the distilled water from the burette
- Heat the mixture as you stir gently with the thermometer until all the solid completely dissolves
- Allow the solution to cool slowly as you continue stirring with the thermometer and note the temperature at which the crystals begins to form/just appears
- Record this temperature in the table below
- Add 2cm3 of distilled water from the burette to the same mixture in the boiling tube and repeat [3], [4] and [5] above
- Add 2cm more of distilled water to the mixture and repeat 3,4 and 5 above again
- Continue adding 2cm3 of distilled water as you repeat 3,4 and 5 above until the total volume of distilled water added to solid C is 12cm3
Total volume of distilled water Added to solid C in cm3
Temp. in 0C at which crystals Of solid C appears/begin to form
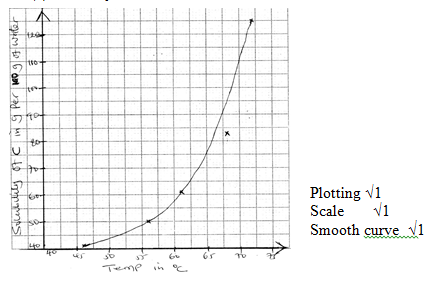
Solubility of solid C in g Per 100g of water
4
6
8
10
12
- Complete the table by filling the solubilities of solid C in g per 100g of distilled water [1mk]
- Using your table, plot the solubility curve of solid C by plotting the solubility of solid C against the temperature at which crystals firs appear
- From your graph, determine the solubility of solid C at;
- 680C [1mk]
- 620C [5mks]
- From your graph, explain the relationship between temperature and the solubility of solid C[1mk]
QUESTION 3
- You are provided with solid D and E
- You are required to carry out the tests below as you write down the observations and the inferences
- SOLID D
TEST
OBSERVATION
INFERENCES
(a) [i]
Scoop half of solid D with a metallic spatula and put into a Clean test tube
Add about 2cm3 of distilled water and shake well. Divided the resulting mixture into 2 portions
[1mk]
[1mk]
[ii]
To the 1st portion, add NaOH[aq] drop wise till excess
[1mk]
[1mk]
[iii]
Fetch a few drops of the 2nd portion on a metallic spatula and heat on a non-luminous flame
[1mk]
[ 1/2 mark]
(b) [i]
Put the other half of solid D into another clean test tube and add HNO3 drop wise until there is no further change. Divide the resulting mixture into 2 portions
[1/2 mark]
[1/2 mark]
[ii]
To the 1st portion, add 3 drops of Pb[NO3]2 [aq]
[1/2 mark]
[1mark]
[iii]
To the 2nd portion, add three drops of Ba(NO3)2 (aq)
[1/2 mark]
[1/2 mark]
- SOLID E
TEST
OBSERVATIONS
INFERENCES
(a)
Scoop half of solid E on a metallic spatula and heat on a non-luminous flame
[1mk]
[1mks]
(b) [i]
Put the remaining solid E into a clean test tube and add about 2cm3 of distilled water. Shake the mixture and divide into 2 portions
[1mk]
[1mk]
[ii]
Determine the PH of the first portion
[1mark]
[1mark]
[iii]
To the second portion, add 2 drops of bromine water and warm
[1mark]
[1mark]

MARKING SCHEME
- Table
Complete table √1
d.p√1
P.O.A √1
Accuracy √1
NB:/Theoritically expected average value= 16.0cm3-
- average volume- tied to school value
-
-
-
-
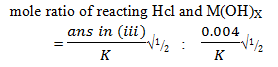
Where K is either ans in a(iii) or ans in a(iv) ( which ever of them is smaller)
Nb: expected mole ratio of Hcl: M(OH)X= 1:1
Thus stoichiometric equation is
HCl(aq) + MOH(aq) →MCl(aq) + H2O(L)√1 - value of X =1√1 (from the stoichiometric equition)
-
- Table
Expected values table
Value of H2O
Temp ᴼC
Solubilities
4
72
125
6
68
83.33
8
61
62.5
10
54
50
12
46
41.67
Complete table √1
Trend- temperature gradually decreasing as volume of water added increases √1
d.p√1
accuracy- tied to school value √1- refer to the table above
√1for complete table - solubility curve
-
- correctly read value from graph √1
- correctly read value from graph √1
- Solubility of solid C increases with increase in temperature √1
- refer to the table above
-
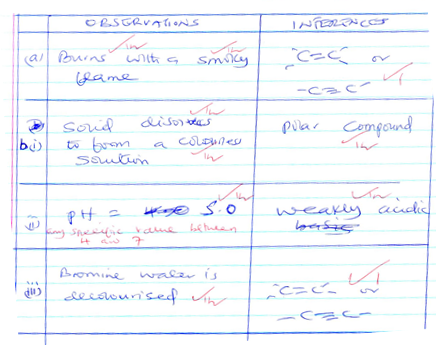
- Solid D
OBSERVATIONS
INFERENCES
A(i)
Solid dissolves √to form a colourless solution√
Fe2+, Fe3+, Cu2+ absent √1
(ii)
No white ppt √
Ca2+, Mg2+, Al3+, Pb2+, Zn2+ absent√1
(iii)
Burns √with a golden yellow √
Na+confimed√
b(i)
Effervescence occurs √
HCO-3, SO2-3 , CO2-3 Present √1
(ii)
White ppt formed √
SO42-, Cl-√1
(iii)
White ppt formed √
SO42- Confirmed √
- Solid E
- Solid D
Download CHEMISTRY PAPER 3 - KCSE 2019 STAREHE PRE MOCK EXAMINATION (WITH MARKING SCHEME).
Tap Here to Download for 50/-
Get on WhatsApp for 50/-
Why download?
- ✔ To read offline at any time.
- ✔ To Print at your convenience
- ✔ Share Easily with Friends / Students