
BIOLOGY
PAPER 2
FORM 4 MID TERM 2
INSTRUCTIONS
- This paper consists of two sections. A and B.
- Anwer all the questions in section a
- In section B answer question 7(compulsory) and either question 8 or 9
SECTION A 40MKS
Answer all questions in this section in the spaces provided.
- In an ecosystem energy flows from the sun and is transferred in a series of organisms. The diagram represents different levels of energy levels of energy transfer.
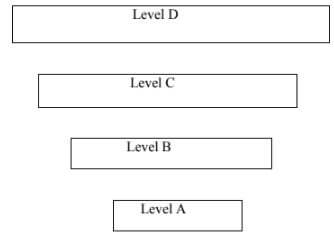
- Insert the sun in the diagram and using arrows show the direction of energy transfer. (1mk)
- Name the trophic levels represented by D and B (2mks)
- Identify the general trend in the amount of energy along the path illustrated in (a) give reasons for the trend. (2mks)
- Explain short term effect of decreasing the number of individuals in the level C. (2mks)
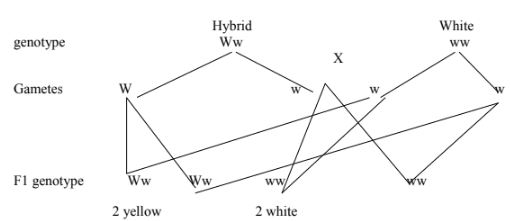
- In maize, yellow colour W is dominant over white colour. Describe how one would establish whether a given sample of yellow maize is pure or hybrid. Show your working. (4mks)
- The sketch graph shows how the metabolic rate in man and lizard is affected by environmental temperature.
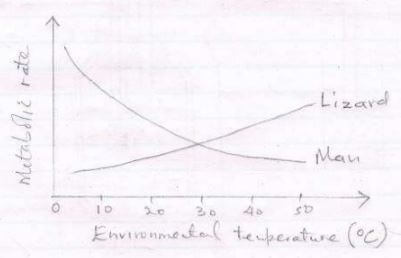
- Suggest why the metabolic rate was high in man between 5oc and 20oc. (2mks)
- Account for increase in metabolic rate in lizard as environmental temperature was increasing.(2mks)
-
- state two physiological processes that occur in man when environmental temperature rises above 35oc. (2mks)
- How would the lizard respond to similar temperature changes in (c) (1mk)
- The apparatus shown was set up by a group of students.
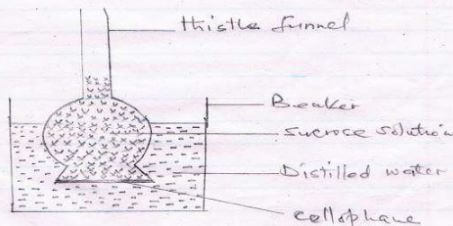
- What was the aim of the experiment? (1mk)
- Explain the results obtained in the set up at the end of the experiment. (2mks)
- State the expected results if the cellophane was replaced with a thin section of
- Raw arrowroot (1mk)
- Boiled arrowroot (1mk)
-
- Account for the results obtained in ( c) (ii). (1mk)
- What is the equivalent of sucrose solution in plant tissue? (3mks)
- The diagram represents a plant cell
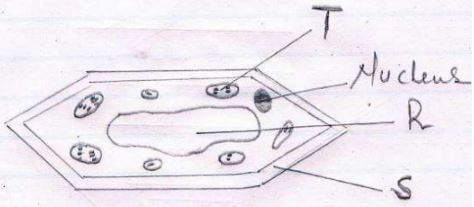
- Name a carbohydrate which forms the structure label S. (1mk)
-
- state the function of the part labeled R (2mks)
- Suggest what would happen in the plant if the number of organelle labeled T isreduced..(1mk)
- Name two cell organelles present in the diagram but absent in animal cells(2mks)
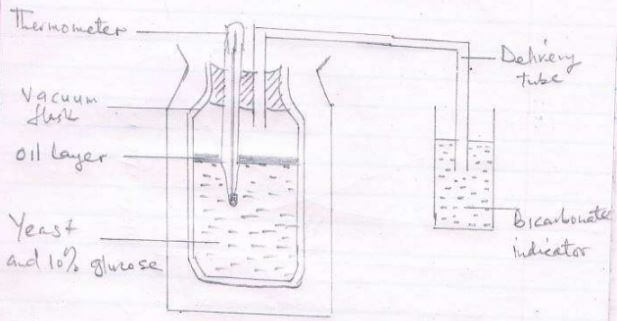
- The set of apparatus was assembled by a group of students to investigate some physiological process.
-
- give two aims of the experiment. (2mks)
- Explain the observation expected after 24 hours. (2mks)
- Before experiment, the glucose solution was boiled then cooled.
- Why was it necessary to boil the solution? (1mk)
- What was the importance of oil layer in the experiment?(1mk)
- Describe a control experiment for the set up. (1mk)
- Suggest two industrial application of the process being investigated. (1mk)
-
SECTION B (40mks)
Answer question 7 (compulsory) and EITHER question 8 or 9 in the spaces provided after question 9
- The table below represents body weight, metabolic rate and eaten per day by different mammals. (Compulsory)
Animal Body weight Metabolic rate (cm3)
Oxygen/ghrFood eaten per day
(kg)Rat 0.10 800 0.098 Hare 2.00 480 1.2 Dog 8.00 300 3.0 Man 60.00 150 4.0 Horse 200.0 100 15.0 Elephant 800.0 86 40.0 -
- Draw a graph of metabolic rate against body weight of the animals (6mks)
- From the graph estimate the metabolic rate of an animal whose body weight is 35 kg (2mks)
- Express the food eaten per day of the following mammals as a percentage of their body weight.
- Rat (2mks)
- Elephant (2mks)
- Account for the difference in percentage obtained in (b) (4mks)
- Which of the six mammals would least suffer dehydration during a sunny day? Give reasons for your answers. (2mks)
- A reptile would require less food than a mammal of the same weight. Explain. (2mks)
-
-
- Define the terms
- Transpiration (2mks)
- Translocation (2mks)
- Explain five factors that affect the rate of transpiration in plants.(16mks)
- Define the terms
-
- Define
- Chemical evolution (2mks)
- Organic evolution (2mks)
- Describe the evidence of organic evolution (16mks)
- Define
MARKING SCHEME
-
-
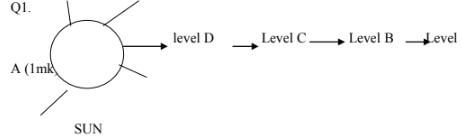
(All must be correct) - B-secondary consumers; D-producers (2mks)
- Amount of energy decrease along the path (from D to A); some energy is lost through respiration unconverted materials and uneaten individuals. (2mks)
- Number of individuals in level B decrease leading to decrease at level A due to starvation/less energy available; number of individuals in level D would increase due to decrease of herbivores/grazers. (2mks)
-
-
- Back cross with white maize (ww)
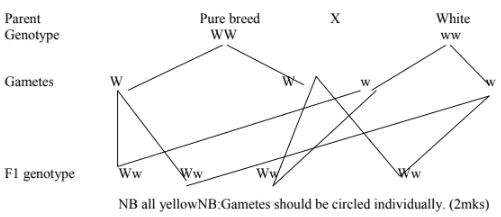
NB all yellowNB:Gametes should be circled individually. (2mks) - Male sex chromosome XY female XX.
50% boys, 50% girls/equal chances (2mks)ova\Sperm X Y X XX
GirlXY
BoyX XX
GirlXY
Boy
- Back cross with white maize (ww)
-
- Environmental temperature lower than body temperature more heat was being generated to maintain body temperature. (2mks)
- The lizard is poikilothermic, enzymes were inactive at low temperature, their activity increased as temperature increased because enzymes were activated.(2mks)
-
- vasodilation, sweating, hair lie flat on skin (first two) (2mks)
- Aestivation, migration to shade, burrowing, sand bathing, (any one correct)(1mk)
-
- To demonstrate osmosis in non -living tissue (1mk)
- Level of sucrose rose in thistle funnel, water drawn into funnel by osmosis,since sucrose solution was hypertonic to/more concentrated than distilled water. (2mks)
-
- Sucrose solution level would rise in funnel.(1mk)
- No observable change/sucrose level remained the same.(1mk)
-
- Cell membrane in arrow root destroyed hence no osmosis (1mk)
- Cell sap/dissolve sugars and salts in vacuole.(1mk)
-
- Cellulose (1mk)
-
- Store sugar/salts/food; create osmotic gradient for osmosis; cause cell turgidity(2mks)
- Rate of photosynthesis would reduce/inadequate food produced.(1mk)
- Cell wall; chloroplast(2mks)
-
-
- to show energy is released in anaerobic respiration; to show carbon( IV) ; oxide is produced in anaerobic respiration. (2mks)
- Increase in temperature since energy is released colour of indicator; changed to yellow due to acidity/carbon. (IV)oxide released changed indicator to yellow. (1mk)
-
- Expel dissolved oxygen; (1mk)
- Prevent entry of air/oxygen into glucose solution.(1mk)
- use glucose solution without yeast/used killed yeast cells.(1mk)
- Ethanol production in breweries, breads production in bakeries.(1mk)
-
-
-
- Labeling axis (2mks)
Scale (2mks)
Curve (1mk)
Plotting (1mk) - 205cm3 oxygen /ghr -1
±5 evidence from gragh (2mkS)
- Labeling axis (2mks)
-
- RAT food eaten X 100% 0.098 X100 = 98% (2mks)
Body weight 0.1 - Elephant 40 X 100 =5% (2mks)
800
- RAT food eaten X 100% 0.098 X100 = 98% (2mks)
- Rat eat more food per unit body weight than elephant; Rat has larger surface area to volume ratio; therefore tend t0 lose more heat per unit body weight; oxidize more food/faster to maintain body temperature(4mks)
- Elephant: least surface area to volume ratio; lose water very slowly since some tissues arefar from body surface; metabolic rate very slow; hence little water lost through sweating per unit body weight(2mks)
- Reptile poikilothermic/depend on environmental temperature; mammal homiothermic/oxidize foodto maintain body temperature (2mks)
-
-
-
- Transpiration is the process by which plants lose water to the atmosphere in form of water vapour
- Translocation is the process by which soluble products of photosynthesis/simple sugars are transported from leaves ;to other parts of the plants through phloem
-
- Temperature: high temperature increases water evaporation from mesophyll cell; increase capacity of atmosphere to hold more water due to faster movement of molecules/ low temperatures reduces therate of water evaporation; air capacity to hold more water hence low transpiration rate
- Humidity:high humidity lower the saturation deficit /reduce ability of atmosphere to hold more water;hence low transpiration rate/low humidity offering great saturation deficit;hence high rate of transpiration
- Light intensity:at low light intensity stomata close; reduce surface area over which water is lost/low transpiration rate/stomata open at high light intensity;surface area hence increases transpiration rate
- Wind/air current:fast air movement /strong air current sweep away saturated air around plant;increasing transpiration rate ;still air/weak air currents make water accumulate around the plant lowering transpiration rate
- Size of stomata/number of stomata/leaf area:large/many stomata/leaves/large area; increase transpiration rate/few leaves/small/few stomata reduce surface area; hence low transpiration rate
- Atmospheric pressure: low atmospheric pressure increase water evaporation; hence high rate of transpiration/high atmospheric pressure reduce water evaporation; hence low rate of transpiration [3marks] award only once in each condition/low or high. {max 16marks}
-
Join our whatsapp group for latest updates
Tap Here to Download for 50/-
Get on WhatsApp for 50/-
Download Biology Paper 2 Questions and Answers - Form 4 Mid Term 2 Exams 2021.
Tap Here to Download for 50/-
Get on WhatsApp for 50/-
Why download?
- ✔ To read offline at any time.
- ✔ To Print at your convenience
- ✔ Share Easily with Friends / Students