
QUESTIONS
SECTION I: Answer all question in this section on the spaces provided
- Without using calculators or mathematical tables, evaluate, leaving your answer in surd form
sin60º × cos30º (3mks)
tan 30º sin30º - The mass in kg of nine sheep in a pen were 13, 8, 16, 17, 19, 20, 15, 14, and 11. Determine the quartile deviation (3mks)
- Find
- The equation of the tangent to the curve y=2x2+ 2 at (2, 8). (3mks)
- The equation of the normal to the curve at the same point. (2mks)
- The figure below is a sketch of a curve whose equation is y=x2+x+5.
It cuts the line y = 11at points P and Q.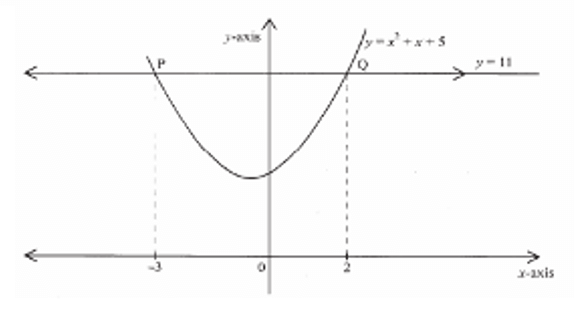
Find the area bounded by the curve y=x2 + x + 5 and the line y = 11 using the trapezium rule with 5 strips - Using a ruler and a pair of compasses only:
- Construct a parallelogram PQRS in which PQ=6 cm, and QR = 4 cm and angle SPQ = 75º (3mks)
- Determine the perpendicular distance between PQ and SR (1mk)
SECTION II (30MKS): Answer any three questions from this section in the spaces provided
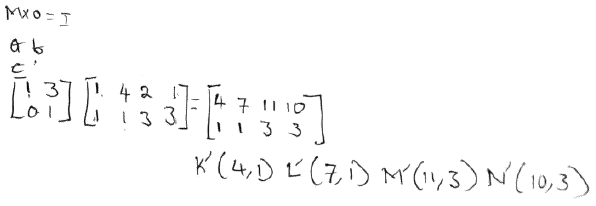
- A quadrilateral with vertices at K(1,1), L(4,1), M(2,3), and N(1,3) is transformed by matrix T= [1 3] to quadrilateral K’L’M’N’.
[0 1]- Determine the coordinates of the image (3mks)
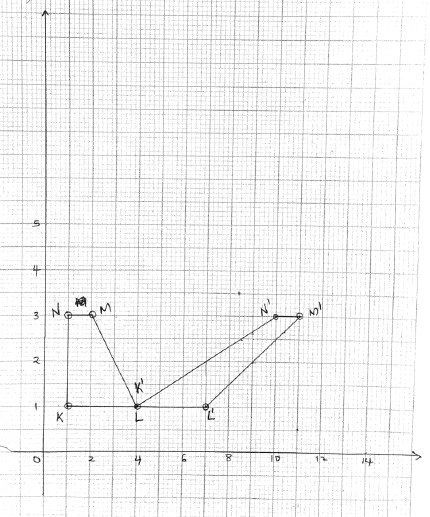
- On the grid provided, draw the object and the image (2mks)
- Describe fully the transformation which maps KLMN onto K’L’M’N’ (2mks)
- Determine the area of the object (1mk)
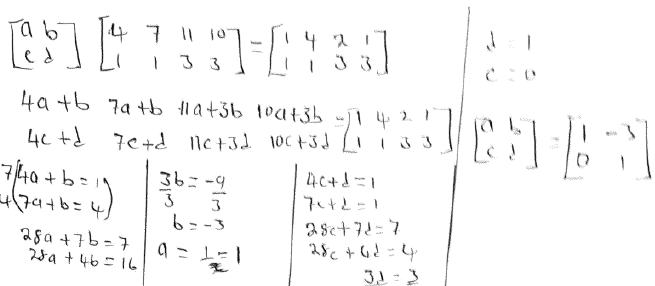
- Find the matrix which maps K’L’M’N’ to KLMN (2mks)
- The positions of three ports A, B, and C are (34ºN, 16ºW), (34ºN, 24ºE) and (26ºS, 16ºW) respectively.
- Find the distance in nautical miles between;
- Ports A and B to the nearest nautical mile. (3mks)
- Ports A and C (2mks)
- A ship left port A on Monday at 1330 h and sailed to port B at 40 knots. Calculate:
- The local time at port B when the ship left port A; (2mks)
- The day and the time the ship arrived at port B. (3mks)
- Find the distance in nautical miles between;
-
- Complete the table below by filling in the blank spaces. (2mks)
X
00
150
300
450
600
750
900
1050
1200
1350
1500
1650
1800
3cos 2x
2.6
1.5
-1.5
-2.5
-3
-2.6
-1.5
1.5
2sin(2x+300)
2
1
0
-1.7
-2
-1
- On the grid provided; draw on the same axis; the graph of y = 3 cos 2x and y = 2sin (2x +30º) for 0º ≤ x ≤180º.
(Take the scale: 1cm for 15º on the x-axis and 2cm for 1 unit on the y-axis). (5mks)
- Using the graph in part (b) above;
- Estimate the solution to the equation 3cos 2x – 2 sin (2x+30º) = 0 (2mks)
- Estimate the range of values of x for which 3cos 2x ≤ 2 sin (2x + 30º) giving your answer to the nearest degree. (1mk)
- Complete the table below by filling in the blank spaces. (2mks)
- The table below shows the number of goals scored in handball matches during a tournament.
No. of goals
0-9
10-19
20-29
30-39
40-49
No. of matches
2
14
24
12
8
- Draw a cumulative frequency curve on the grid provided (5mks)
- Using the curve drawn in (a) above, determine
- The median (1mk)
- The number of matches in which goals scored were not more than 37 (1mk)
- The inter-quartile range (3mks)
MARKING SCHEME
SECTION I: Answer all question in this section on the spaces provided
- Without using calculators or mathematical tables, evaluate, leaving your answer in surd form
sin60º × cos30º (3mks)
tan 30º sin30º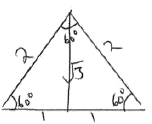
√3/2 × √3/2 = 3/4
1/√3 × 1/2 1/2√3
= 3/4 ÷ 1/2√3
= 3/4 × 2√3
= 3√3/2 - The mass in kg of nine sheep in a pen were 13, 8, 16, 17, 19, 20, 15, 14, and 11. Determine the quartile deviation (3mks)
Q2 = 8, 11, 13, 15, 16, 17, 19, 20
Q1 = 11 + 13 = 12 Q3 = 17 + 19 = 18
2 2
Queasrtile deviation = Q3 - Q1
2
= 18 - 12
2
= 6/2
= 3 - Find
- The equation of the tangent to the curve y=2x2+ 2 at (2, 8). (3mks)
dy = 4x
dx
dy = 2 × 4
dx
= 8
dy = 8
dx
(2, 8) (x, y)
y - 8 = 8
x - 2 1
y - 8 = 8x - 16
y = 8x - 8 - The equation of the normal to the curve at the same point. (2mks)
(2, 8) (x, y)
y - 8 = -1
x - 2 8
8y - 64 = -x + 2
8y = -x + 66
y = -1/8x + 66
- The equation of the tangent to the curve y=2x2+ 2 at (2, 8). (3mks)
- The figure below is a sketch of a curve whose equation is y=x2+x+5.
It cuts the line y = 11at points P and Q.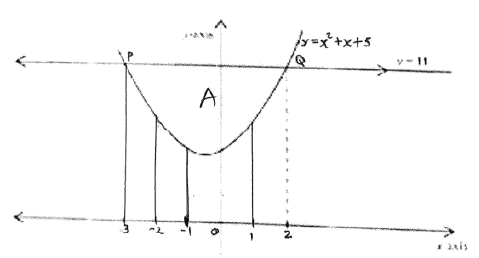
2mks for filling the table for values of yx -3 -2 -1 0 1 2 y 11 7 5 5 7 11
Find the area bounded by the curve y=x2 + x + 5 and the line y = 11 using the trapezium rule with 5 strips
A = rectangular area - area under curve
= 5 × 11 - 1/2 [(11 + 11) + 2(7 + 5 + 5 + 7)]
=55 - 1/2(22 + 48)
= 55 - 35 = 20 sq. units - Using a ruler and a pair of compasses only:
- Construct a parallelogram PQRS in which PQ=6 cm, and QR = 4 cm and angle SPQ = 75º (3mks)
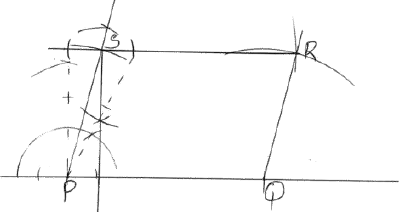
- Determine the perpendicular distance between PQ and SR (1mk)
3.9 cm
- Construct a parallelogram PQRS in which PQ=6 cm, and QR = 4 cm and angle SPQ = 75º (3mks)
SECTION II (30MKS): Answer any three questions from this section in the spaces provided
- A quadrilateral with vertices at K(1,1), L(4,1), M(2,3), and N(1,3) is transformed by matrix T= [1 3] to quadrilateral K’L’M’N’.
[0 1]- Determine the coordinates of the image (3mks)
- On the grid provided, draw the object and the image (2mks)
- Describe fully the transformation which maps KLMN onto K’L’M’N’ (2mks)
is a shear x-axis invariant scale factor 3- Determine the area of the object (1mk)
2 × 1 = 2
1/2 × 2 × 2 = 4 units square
- Determine the area of the object (1mk)
- Find the matrix which maps K’L’M’N’ to KLMN (2mks)
- Determine the coordinates of the image (3mks)
- The positions of three ports A, B, and C are (34ºN, 16ºW), (34ºN, 24ºE) and (26ºS, 16ºW) respectively.
- Find the distance in nautical miles between;
- Ports A and B to the nearest nautical mile. (3mks)
- Ports A and C (2mks)
- A ship left port A on Monday at 1330 h and sailed to port B at 40 knots. Calculate:
- The local time at port B when the ship left port A; (2mks)
- The day and the time the ship arrived at port B. (3mks)
- Find the distance in nautical miles between;
-
- Complete the table below by filling in the blank spaces. (2mks)
X
00
150
300
450
600
750
900
1050
1200
1350
1500
1650
1800
3cos 2x
3 2.6
1.5
2.0 -1.5
-2.5
-3
-2.6
-1.5
0 1.5
2.6 3 2sin(2x+300)
1 1.7 2
1.7 1
0
-1 -1.7
-2
-1.7 -1
0 1 - On the grid provided; draw on the same axis; the graph of y = 3 cos 2x and y = 2sin (2x +30º) for 0º ≤ x ≤180º.
(Take the scale: 1cm for 15º on the x-axis and 2cm for 1 unit on the y-axis). (5mks)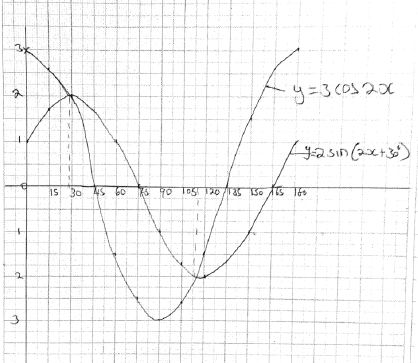
- Using the graph in part (b) above;
- Estimate the solution to the equation 3cos 2x – 2 sin (2x+30º) = 0 (2mks)
28.5º, 115.5º - Estimate the range of values of x for which 3cos 2x ≤ 2 sin (2x + 30º) giving your answer to the nearest degree. (1mk)
28.5º ≤ x ≤ 115.5º
- Estimate the solution to the equation 3cos 2x – 2 sin (2x+30º) = 0 (2mks)
- Complete the table below by filling in the blank spaces. (2mks)
- The table below shows the number of goals scored in handball matches during a tournament.
No. of goals
0-9
10-19
20-29
30-39
40-49
No. of matches
2
14
24
12
8
cf 2 16 40 52 60 - Draw a cumulative frequency curve on the grid provided (5mks)
row showing cummulative frequency (1 mk)
appropriate scale(both x and y axis) (1 mk)
axis labelling (1 mk) ; x-axis - no of goals
y-axis - cummulative freq.
correct plotting of all 5 points (1 mk)
smooth curve (1 mk)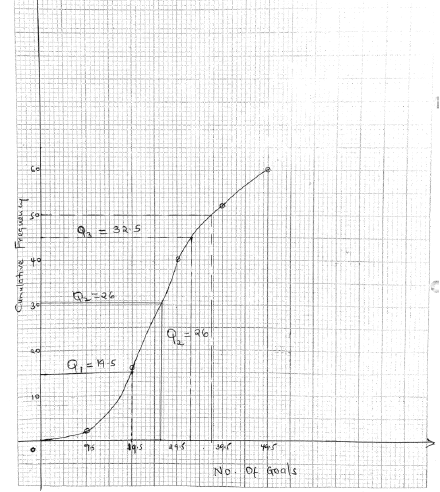
- Using the curve drawn in (a) above, determine
- The median (1mk)
Q2 = 26 goals - The number of matches in which goals scored were not more than 37 (1mk)
goals scored ≤ 37 ⇒ 50 mathces - The inter-quartile range (3mks)
= Q3 - Q1
= 32.5 - 19.5
= 13 goals
- The median (1mk)
- Draw a cumulative frequency curve on the grid provided (5mks)
Join our whatsapp group for latest updates
Tap Here to Download for 50/-
Get on WhatsApp for 50/-
Download Mathematics Questions and Answers - Form 4 Mid-term Exams Term 1 2022.
Tap Here to Download for 50/-
Get on WhatsApp for 50/-
Why download?
- ✔ To read offline at any time.
- ✔ To Print at your convenience
- ✔ Share Easily with Friends / Students